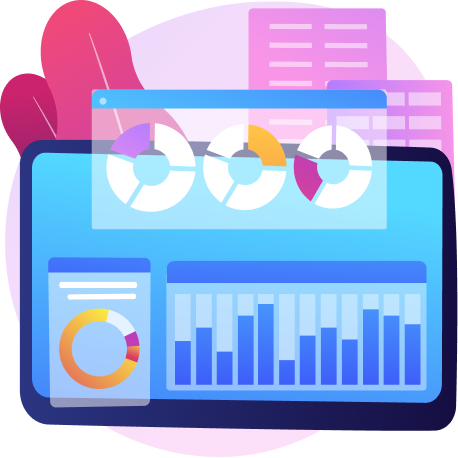


Convert large datasets into easy-to-digest visuals that communicate insights at a glance.
Visual insights help stakeholders quickly grasp trends, patterns, and anomalies.
Dashboards and reports provide a shared view for teams across marketing, finance, operations, and leadership.
Interactive dashboards enable live tracking of KPIs, user behavior, and business metrics in one place.
Build custom dashboards with drill-down, filters, and real-time updates.
Visualizations inside BI platforms like Power BI, Tableau, Looker, Qlik, Superset, etc.

Streaming data views and live dashboards for time-sensitive metrics.
Including bar charts, line graphs, heatmaps, geo-maps, funnel charts, etc.
Tailored design, branding, color schemes, and user flows.
Clean, modern, and intuitive dashboards designed for clarity.
Dashboards look great and perform flawlessly on desktop, tablet, and mobile.
Built on solid data architecture — easy to extend and update as datasets grow.
Role-based access, intuitive navigation, and easy-to-use controls for all stakeholders.
Understand your data sources, business goals, stakeholders, KPIs, and visualization needs.
Ensure clean, structured, and accessible data for visualization.
Create mockups and prototypes to define layout, charts, styling, and interactions.
Build the dashboard using chosen BI/visualization tools or custom front-end frameworks.
Ensure responsiveness, performance, data accuracy, usability, and design consistency.
Bring your data vision to life with stunning, insightful, and interactive visualizations. Let’s turn numbers into stories.
Codiot Technologies has been our trusted technology partner since the beginning. They understood our complex requirements as an angel investment firm and delivered an integrated solution that seamlessly connects Salesforce, mobile apps, AWS services, and WhatsApp bots. Their expertise helped us streamline our business processes and improve customer complaint resolution significantly. The team’s commitment to our success is evident in every aspect of the solution they built.
Angel investment platform
From concept to successful ecommerce brand, Codiot has been with us every step of the way. As fitness enthusiasts launching a business, we had a vision but needed technology partners who could execute. They built our Shopify platform, handled all graphic designs, managed digital marketing (PPC, social media, SEO), and integrated everything with Salesforce. Their attention to detail—down to color choices and logo placement—shows they truly care about our success.
Fitness food brand
As a global freelancer marketplace, we needed sophisticated technology to stand out. Codiot Technologies delivered a complete platform with AI-powered talent matching, seamless collaboration tools, and secure payment systems. They built everything from the ground up—intuitive user interfaces, robust backend systems, and smart algorithms that connect the right freelancers with the right opportunities. Their ability to understand marketplace dynamics and translate that into functional technology was exceptional. Codiot didn’t just build our platform; they enabled our entire business model.
Talent market place
“Managing a platform connecting over 1000s of CXOs required sophisticated technology and flawless execution. Codiot served as our technology consultant and developed both Android and iOS apps that enable real-time connections among our members. Their profile management system and the fully integrated solution they built helps CXOs find practical solutions and advice on various challenges. The platform they created is the foundation of our thriving community.”
CXO networking platform
“Codiot developed a comprehensive field force management solution that transformed how we operate across multiple departments. From Android and iOS apps to Salesforce lead management, their technology consulting guided us in making the right choices. The integration of our marketing team, warehouse management, and sales team management into one cohesive system has dramatically improved our efficiency as a leading eyewear brand.”
Eye wear brand
“Building a community-based resource-sharing platform required both technical expertise and understanding of social dynamics. Codiot delivered on both fronts with our mobile and web platform. The Android and iOS apps they developed, powered by Node.js and MongoDB on AWS, enable users to share resources and become Social Heroes. Their role as technology partners helped us turn a social mission into a viable technology platform.”
Resource sharing platform
“Codiot consulted on and built our entire platform to maximize value for users through soft currency. Their expertise in Android and iOS development, combined with scalable AWS hosting and Core PHP backend, created a robust foundation for our business. They understood our unique business model and translated it into a technology solution that works seamlessly across all platforms.”
Loyalty management platform
“As a UK-based beauty and cosmetics ecommerce business, we needed an end-to-end solution that could handle multiple brands under one roof. Codiot provided exactly that—from Shopify platform development to graphic designs, digital marketing (PPC, social media, SEO), product data management, and customer support. They’re not just developers; they’re partners invested in our success in the competitive UK market.”
Cosmetic and beauty ecommorce marketplace
“Working with Codiot was transformational for our ad sales operations. They created a comprehensive Salesforce solution that gave us complete visibility into our sales funnel, from forecasting to deal tracking. The real-time inventory tracker and seamless integration with our legacy systems through SSO has empowered our leadership to make data-driven decisions. The result? Increased efficiency and a clear path to sustainable growth.”
Media Giant
“Codiot’s expertise in Salesforce and mobile development helped us revolutionize our procurement processes. Their solution featuring LWC components, native mobile apps, and advanced workflows has streamlined everything from invoice management to dispute resolution. The team’s product consulting was invaluable, and they delivered a system that truly enhances both efficiency and user experience.”
Enterprise Order to Cash
“As a global pharma company with geographically dispersed sales teams, we needed a robust CPQ solution to handle our complex sales processes. Codiot delivered beyond expectations with custom pricing flows, advanced constraint rules, and catalog customization. Their deep knowledge of Apttus/Conga CPQ and attention to detail in implementing promotional rules has made collaboration on quotations seamless across our organization.”
Global Pharm Company (Apttus/Conga CPQ - Project 1)
“Managing over 1000+ complex products with customization needs was a significant challenge for us. Codiot’s team tackled this head-on with n-level product attributes, X-author integration for large carts, and Apttus AWA for multi-level approvals. The SAP integration they implemented has connected our entire sales ecosystem. Their technical expertise and problem-solving approach made a complex project feel manageable.”
IT Service Provider (Apttus/Conga CPQ - Project 2)
“What sets Codiot apart is their ability to combine technical excellence with beautiful UI design. They built our entire CPQ solution using LWC components with custom APEX controllers, creating a user experience that our sales team loves. The integration with non-Salesforce products through CPQ APIs and the user segment-based renewal module have been game-changers for managing our dynamic sales operations.”
SaaS Company (Apttus/Conga CPQ - Project 3)
“Migrating from a legacy CLM system to Salesforce was daunting, especially with years of complex contract data. Codiot not only created a solution for our future needs but also successfully migrated our historical data. Their implementation of KIRA for paper-based contracts, X-Author for negotiations, and seamless DocuSign integration supporting 10+ contract types has modernized our entire contract lifecycle management.”
CLM Implementation
“Codiot built our entire ecommerce platform from the ground up, understanding that bralettes are more than just innerwear. They set up our complete ordering cycle, integrated payment and logistics seamlessly, and used Salesforce for efficient order management and fulfillment. Their B2C website design perfectly captures our brand essence, and the technology backbone they created supports our growth ambitions.”
Online Shop (Bralettes)
“We experienced 2x revenue growth in just one year thanks to Codiot’s technology solutions. Their user experience engineering made shopping on our B2C website intuitive and enjoyable. The complete ordering cycle setup, payment and logistics integration, and Magento technology hosted on AWS with CDN implementation provided us with an enterprise-grade platform that could handle our growth. They’re more than vendors—they’re growth partners.”
eCommerce Solution (Travel Accessories)
“Codiot revolutionized how fine dining restaurants can operate with their electronic menu and ordering system. The solution they built featuring multi-menu support, combo offers, multi-lingual capabilities, and happy hour functionality reduces staff workload while enhancing customer experience. The Java backend on AWS and Angular frontend they implemented is both powerful and user-friendly. They truly understand hospitality technology.”
Fine Dine Ordering Solution

We build dashboards, charts, heatmaps, geo-maps, time-series graphs, funnel charts, KPIs, and custom visualizations tailored to your business needs.
Yes — all dashboards are responsive and optimized for desktop, tablet, and mobile viewing.
We use tools such as Power BI, Tableau, Looker, Qlik, Superset, Metabase, and custom front-end frameworks for embedded dashboards and web-apps.
Absolutely — we support real-time and live-data dashboards using streaming technologies and real-time APIs.
Yes — platforms support exporting to PDF, Excel or CSV, scheduling reports, sharing, and role-based access control.