CPQ Pricing and Licensing Models, Explained Honestly
CPQ pricing and licensing models are less a list of numbers than a set of shapes, and understanding the shape you are buying, per-user, consumption, or a platform bundle, matters more than any headline figure, because the shape decides what you pay as you grow. Most serious CPQ is sold on quote-based enterprise pricing rather than a public price, and the real cost surprises live in renewals and in how the model scales, not in the first-year quote. This is a CFO's honest guide to the licensing models themselves, kept deliberately separate from what a project costs to build, so you can compare vendors on the terms that actually matter.
I am a CFO, and I have signed and renewed enough software contracts to know that the licensing model, not the launch discount, is what you live with. So this is about the models, not a price list, because a price list would be both stale and beside the point. For what the implementation itself costs, our CPQ implementation cost write-up handles that; here I stay strictly on licensing.
How are CPQ tools actually priced?
CPQ tools are priced in one of three broad shapes, and most vendors are really a blend of them: per-user licensing, consumption or volume-based licensing, and a platform or bundle arrangement where CPQ is one line inside a larger deal. Knowing which shape you are being sold is the first move, because everything about how the cost behaves over time follows from it.
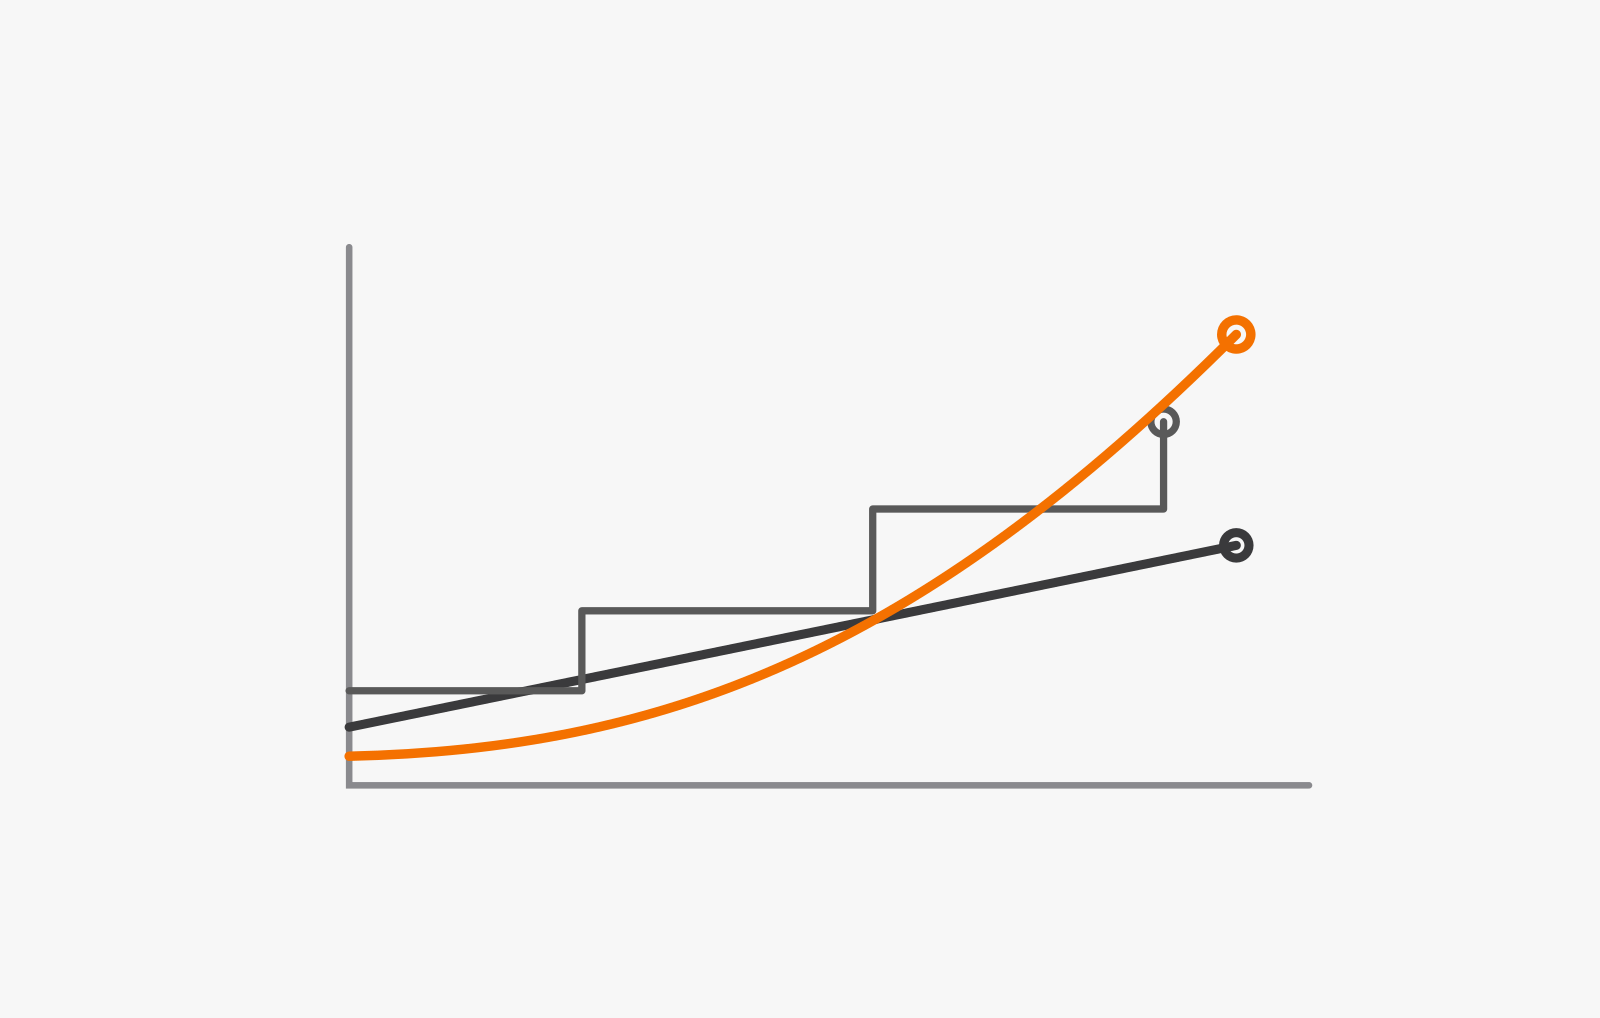
Per-user pricing charges for each person who uses the tool, which is simple and predictable but scales directly with your team. Consumption pricing charges for what you use, often measured in quotes, orders, or transactions, which can be cheap at low volume and expensive as you grow. And platform pricing folds CPQ into a broader agreement, common when CPQ lives inside a suite you already buy, where the CPQ cost is entangled with the rest of the relationship and harder to isolate. Very few vendors publish reliable numbers for any of these, because serious CPQ is sold through sales, so the honest expectation is quote-based pricing that you have to negotiate and confirm as of a specific date rather than read off a page. This opacity is not an accident; it lets a vendor price to what your account is worth to them rather than to a public rate, which is why two similar companies can pay very different numbers for the same tool. It also means the single most useful thing you can bring to a pricing conversation is a clear picture of your own usage, because the vendor certainly has one of you.
What is the difference between per-user and consumption pricing?
The difference between per-user and consumption pricing is the difference between paying for access and paying for activity, and it determines whether your bill tracks your headcount or your volume. Neither is inherently better; each rewards a different usage shape and punishes the other.
Per-user pricing suits a stable, bounded team of sellers, because the cost is predictable and does not spike when a busy quarter drives up quoting activity. Its weakness is that it charges for occasional users the same as heavy ones, so a large team with light users pays for seats it barely uses. Consumption pricing inverts that: it is kind to low or uneven usage and to large teams of infrequent quoters, but it punishes growth, because your bill rises exactly as your business succeeds, and a spiky quarter can produce a bill nobody forecast. The right choice comes from modeling both against your realistic three-year usage, growth included, rather than the tidy first-year numbers a vendor will lead with. I have watched the cheaper-looking model on day one become the more expensive one by year three often enough to treat the day-one comparison with suspicion. The trap is that the day-one numbers are the ones a vendor volunteers and the three-year numbers are the ones you have to build yourself, so the easy comparison is the misleading one. Doing the harder arithmetic is exactly where the real savings hide.
Why do renewals cost more than you expect?
Renewals cost more than the first year because the first year was priced to win your business and the renewal is priced against the reality of how much you now use the tool, plus whatever list-price increases the contract permits. This is the single most common cost surprise in CPQ, and it is almost entirely avoidable at signing.
The mechanics are simple. The seats you added, the volume you grew into, and the modules you switched on mid-term all show up at renewal, and the generous discount that won the deal often quietly narrows once you are committed and your data lives in the system. The negotiating power you had before signing is largely gone by renewal, which is exactly why the renewal is where the vendor recovers margin. The defense is to negotiate the things that bite later while you still hold the upper hand: cap the annual increase, secure price protection on the units you expect to grow, and agree renewal terms up front rather than discovering them when you have no realistic alternative. A model that looks cheap in year one and has no renewal guardrails is not cheap; it is a deferred bill.
How does CPQ pricing sit inside a bigger platform deal?
When CPQ is part of a larger platform, its pricing stops being a standalone number and becomes a negotiating chip inside a bigger relationship, which is both an opportunity and a trap. If you already run the platform, adding CPQ can be efficient and the incremental cost can be genuinely reasonable; it can also be bundled in ways that make the true CPQ cost hard to see and hard to compare against a standalone tool.
The discipline here is to insist on understanding the CPQ line on its own terms even inside a bundle, so you know what you are actually paying for the capability rather than accepting a blended number you cannot benchmark. A platform deal can be the best value available, especially when the integration savings are real, but only if you can still answer the question of what CPQ specifically costs you and what it would cost elsewhere. Our CPQ software comparison is a useful reference when you are weighing a platform-native option against a standalone one. A useful discipline inside a bundle is to ask the vendor to price CPQ as a standalone line as well, even if you fully intend to buy the bundle, because the gap between the two numbers tells you exactly what the bundle is charging you for the convenience, and whether that convenience is actually worth it. Vendors rarely volunteer that breakdown, which is reason enough to ask for it.
How should you compare pricing models fairly?
You compare CPQ pricing models fairly by modeling each against the same realistic three-year usage picture, including growth, and comparing the total shape rather than the first-year price. A fair comparison is not which quote is lowest today; it is which model costs least over the life of the relationship given how you will actually use it.
The worked version, kept qualitative because your numbers are yours, looks like this. Take your expected users and quoting volume for years one, two, and three, with honest growth built in. Run each vendor's model against that same picture, including renewal increases and the cost of the modules you will realistically switch on. Then compare the three-year totals and, just as importantly, the predictability of each, because a slightly higher but stable cost can be worth more to a finance team than a lower but volatile one. Do that and the cheapest headline often stops being the cheapest deal. One more honest caution: do not let a large first-year discount decide the comparison, because a discount is a one-time gift and the model is a permanent structure. A worse model with a better opening discount is a trap that closes at renewal, and the vendors who lead hardest with the discount are frequently the ones counting on you to forget that. If you want the licensing analysis done alongside the full implementation picture rather than in isolation, our CPQ work, and the Salesforce development team behind it, sizes both together, because the two decisions are easier to make well when you see them side by side. For a live example, our global CPQ with a shared pricing engine case study shows the model working across a dispersed sales team.