What Is Business Intelligence (BI)? Complete Guide Most organisations sit on more data than they can process. Customer transactions, CRM records, marketing metrics, financial reports — it piles up fast. Yet according to Seagate's Rethink Data report, 68% of enterprise data goes unleveraged. Decisions get delayed, opportunities slip by, and competitors who figured out how to use their data pull ahead.

Business intelligence (BI) is the framework that closes that gap — turning scattered organisational data into clear, actionable insight. This guide covers exactly what BI is, how it works, the four types of analysis it uses, the benefits it delivers, and how to start building a BI strategy for your business.


TL;DR

  • BI turns raw organisational data into decisions — combining tools, processes, and people, not software alone
  • The BI workflow runs through five stages: Data Sourcing → Preparation → Analysis → Visualisation → Action
  • Four analysis types build on each other: Descriptive, Diagnostic, Predictive, and Prescriptive
  • BARC's BI & Analytics Survey found 95% of BI users report faster decisions and 93% report better outcomes
  • Self-service BI tools make the practice accessible to startups and SMEs — no enterprise budget required

What Is Business Intelligence (BI)?

Business intelligence is a combination of technologies, processes, and strategies that collect, store, analyse, and present organisational data — so leaders can make faster, more informed decisions. The key word is practice. BI is not a single tool you install; it is an end-to-end data discipline that spans people, processes, and platforms.

BI acts as both a rearview mirror and a windshield. Historical data tells you what happened and where you have been; current operational data shows you conditions on the road ahead. Together, they replace gut-feel decisions with evidence — but BI does not make those decisions for you. It surfaces the right information so you can decide wisely.

BI vs. Business Analytics: What's the Difference?

The two terms often get used interchangeably, but there is a practical distinction:

Business Intelligence Business Analytics
Core question What happened? What is happening now? What will happen? What should we do?
Focus Descriptive reporting, monitoring, dashboards Predictive modelling, prescriptive recommendations
Primary users Business users, executives, operations Data analysts, data scientists
Time orientation Historical and current Future-facing

Business analytics sits within a broader BI strategy — it extends the foundation that BI builds. As organisations mature, they move from purely descriptive reporting toward predictive and prescriptive capabilities.

That maturity path also reflects how the market itself has changed. Early BI was IT-driven: static reports, weeks of wait time, centralised control. Modern self-service BI puts interactive dashboards and AI-assisted insights directly in the hands of business users — letting teams query data, build reports, and act on findings without routing every request through a data team.


How Does Business Intelligence Work? The 5 Stages

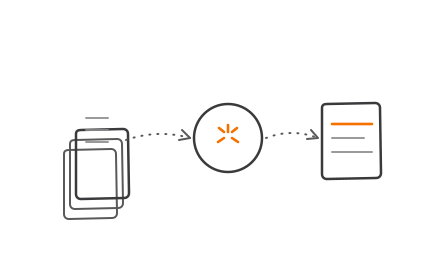
BI is not a one-time project. It is a continuous cycle. Modern platforms automate much of the heavy lifting that once required dedicated data science teams, but understanding the workflow helps you identify where breakdowns occur.

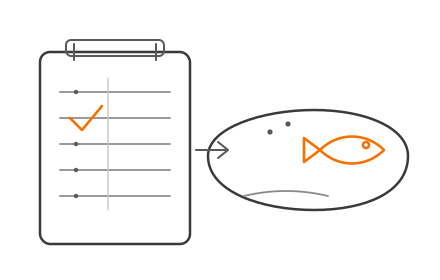
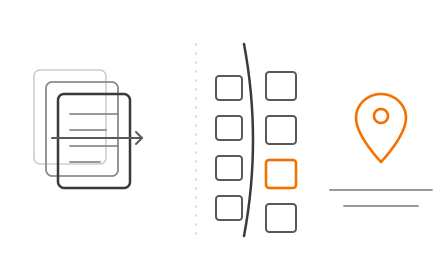
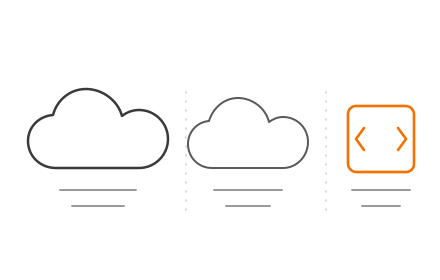
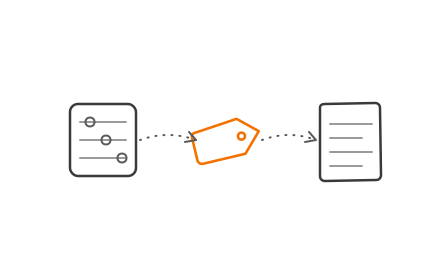
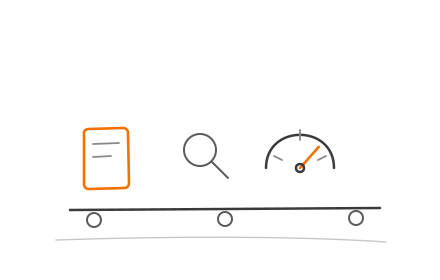
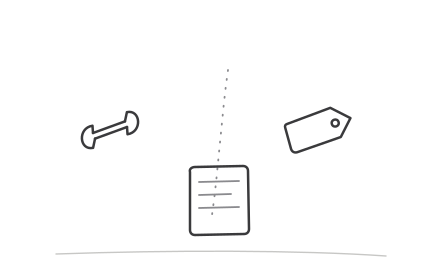
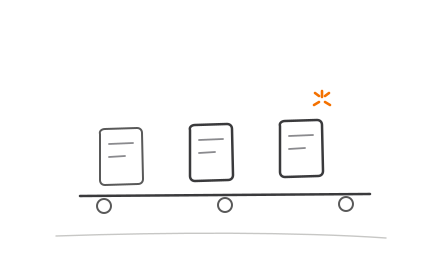
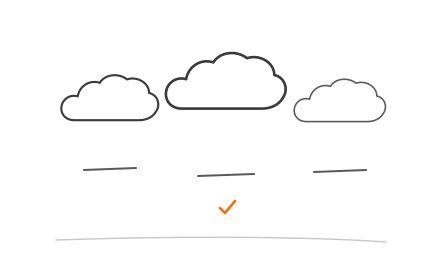
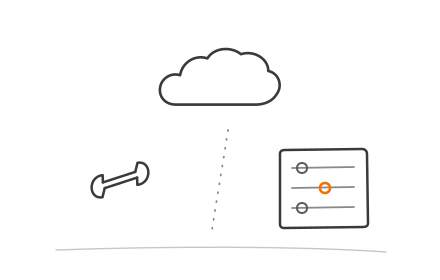
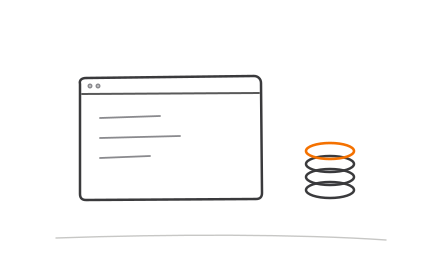
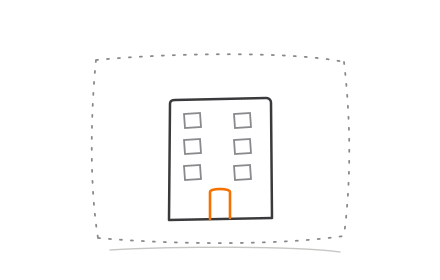
The five stages: Data Sourcing → Data Collection & Preparation → Analysis → Visualisation → Action & Iteration

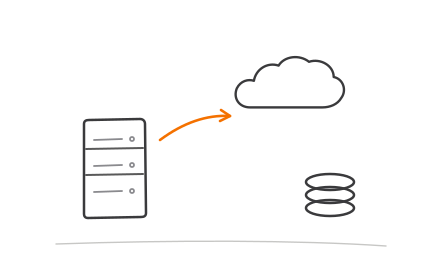
5-stage business intelligence workflow process flow from data sourcing to action

Stage 1 — Data Sourcing

BI pulls from wherever your organisation generates data:

  • Internal systems: ERP, CRM, transactional databases, supply chain platforms
  • Marketing platforms: campaign analytics, email performance, ad spend data
  • External sources: market data, social media signals, competitor benchmarks

The breadth and quality of your source coverage directly determines the quality of insight downstream. Gaps here mean blind spots in every dashboard you build.

Stage 2 — Data Collection & Preparation

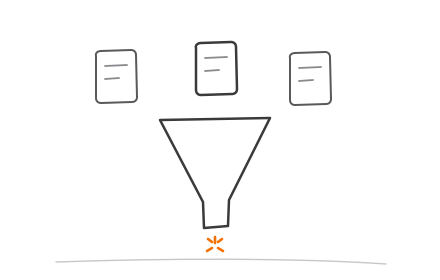
Raw data is rarely usable as-is. The ETL process handles this:

  1. Extract — pull raw data from source systems
  2. Transform — clean, standardise, de-duplicate, and validate the data
  3. Load — move the prepared data into a central data warehouse or data lake

This stage is where most BI projects fail quietly. Poor data quality does not announce itself — it just erodes the accuracy of every insight that follows. Gartner estimates poor data quality costs organisations at least $12.9 million (USD) per year on average.

Stage 3 — Analysis

With clean data in a warehouse, BI platforms apply data mining, statistical modelling, and increasingly AI/ML algorithms to surface:

  • Patterns and correlations across datasets
  • Anomalies that signal problems or opportunities
  • Trends across time periods and business units

Modern platforms surface these findings automatically, without analysts writing manual queries.

Stage 4 — Visualisation

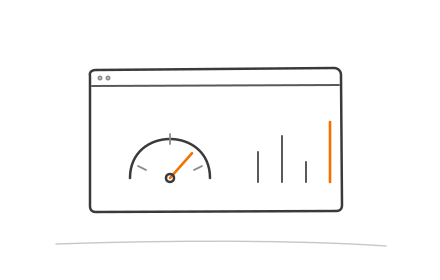
Analysis only creates value when people understand it. Visualisation converts findings into dashboards, charts, graphs, and maps that communicate clearly to both technical and non-technical stakeholders.

The best visualisations are interactive, allowing users to drill into underlying data for deeper context. A sales leader should be able to click from a regional revenue summary into individual account performance without filing a data request.

Stage 5 — Action & Iteration

Insights translate into decisions: pricing adjustments, inventory corrections, marketing pivots, process changes. Each decision generates new questions, feeding the next loop. Organisations that treat BI as a continuous improvement process consistently extract more value than those that treat a finished dashboard as the goal.


The 4 Types of Data Analysis in Business Intelligence

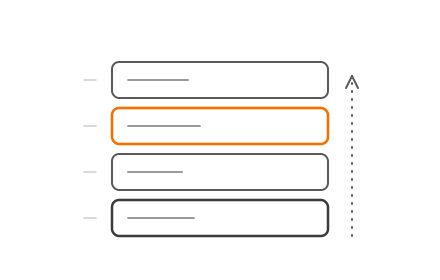
These four types form a hierarchy — from backward-looking to forward-looking. Most organisations start with descriptive analysis and build capability toward prescriptive over time.

A quick reference before diving in:

  • Descriptive — What happened?
  • Diagnostic — Why did it happen?
  • Predictive — What is likely to happen?
  • Prescriptive — What should we do?

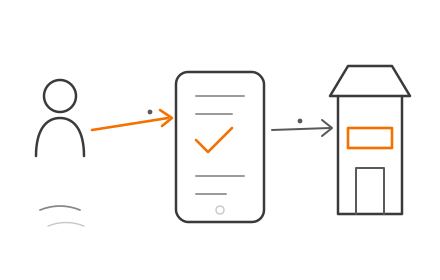
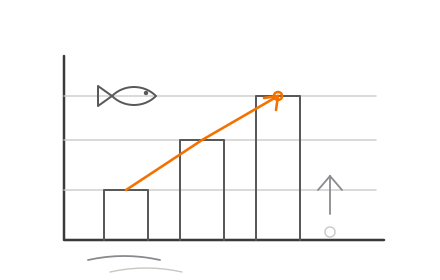
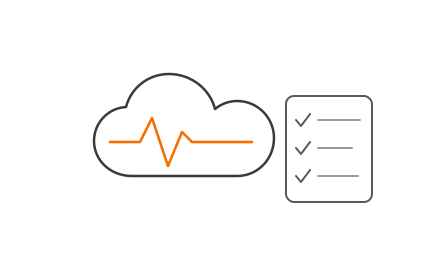
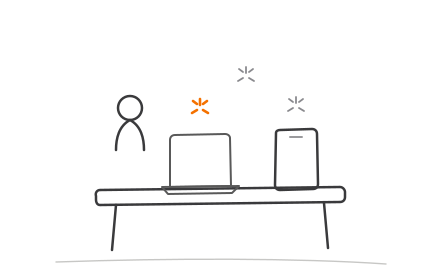
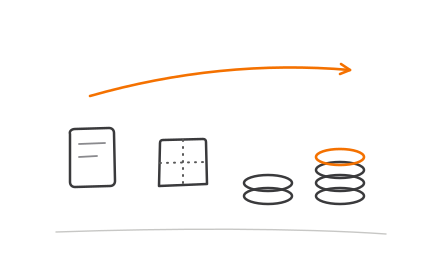
Four types of business intelligence analytics hierarchy from descriptive to prescriptive

Descriptive Analytics

Descriptive analytics answers the question: what happened? It summarises historical data through reports, dashboards, and KPIs — and is the most common starting point. A monthly sales report showing revenue by region, product line, or sales representative is a straightforward example.

Nearly every organisation already does some form of descriptive analytics, often in spreadsheets. The step up to BI is automating and centralising it.

Diagnostic Analytics

Diagnostic analytics asks why something happened. It drills into data to find root causes and correlations. For example: sales dropped in Q3 — diagnostic analysis reveals that a specific product's return rate spiked, correlating with a supplier quality issue flagged two months earlier.

This is where BI moves beyond reporting and starts delivering real insight.

Predictive Analytics

Predictive analytics applies statistical models and machine learning to historical data to forecast future outcomes. A practical example: identifying customers with high churn risk based on usage patterns, support ticket frequency, and payment behaviour — before they actually leave.

This type requires cleaner data pipelines and stronger governance than descriptive or diagnostic work.

Prescriptive Analytics

Prescriptive analytics is the most advanced tier. It does not just forecast outcomes — it recommends specific actions based on modelled scenarios. For example: automatically recommending optimal pricing for a product SKU based on demand signals, competitor pricing, and inventory levels.

This tier is increasingly powered by AI. Organisations that reach it stop using BI purely as a reporting tool and start using it to drive decisions in real time.


Key Benefits of Business Intelligence

The BARC BI & Analytics Survey found that 95% of BI users achieved faster reporting, analysis, or planning and 93% achieved better business decisions to a high or moderate degree. These figures come from organisations that have already implemented BI — not projections.

Operational benefits:

  • Faster decisions via real-time dashboards (no more waiting for weekly reports)
  • Improved accuracy by replacing guesswork with actual data
  • Consolidated visibility across multiple systems in a single view
  • Earlier identification of operational inefficiencies before they compound

Strategic benefits:

  • Spot market trends before they peak
  • Understand customer behaviour at segment and individual level
  • Measure campaign and sales performance with precision
  • Track competitive position continuously, not quarterly

For startups and SMEs specifically, BI levels the playing field. Modern self-service BI platforms no longer require a dedicated data team or expensive infrastructure. A small finance team can get revenue visibility that previously only enterprise organisations could access.

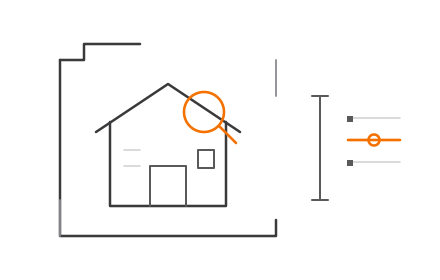
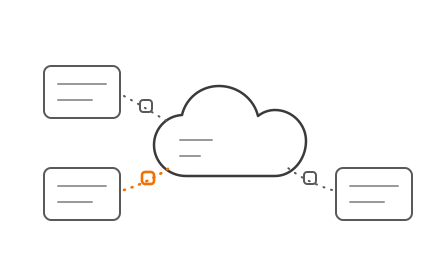
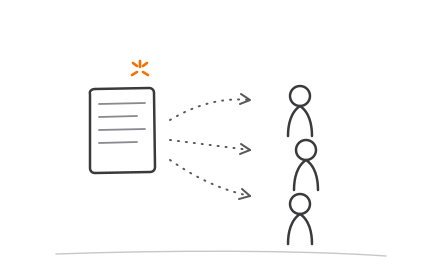
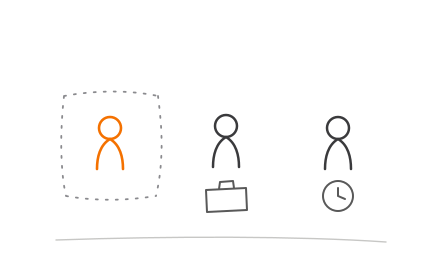
Business intelligence key benefits comparison operational versus strategic outcomes

The stakes are especially high in finance and lending. BI delivers risk visibility, compliance reporting, and customer portfolio monitoring — and in some cases, it's not optional. The Bank for International Settlements' BCBS 239 framework sets 14 principles for risk data aggregation and reporting, making reliable, timely BI a regulatory requirement rather than a business preference.


Business Intelligence Use Cases Across Industries

Finance & Banking

  • Monitor branch and portfolio performance in real time
  • Assess credit risk with data-driven scoring models
  • Detect fraud patterns through anomaly detection on transaction data
  • Generate regulatory reports that meet frameworks like BCBS 239

For private lenders and investment firms, BI provides the customer portfolio visibility and risk monitoring that manual spreadsheet processes cannot scale to support.

Retail, Manufacturing & Healthcare

Industry Primary BI Use Cases
Retail Demand forecasting, inventory optimisation, product segmentation
Manufacturing Supply chain bottleneck detection, production KPI monitoring, capacity planning
Healthcare Patient data analysis, operational efficiency tracking, resource allocation

Deloitte's retail planning guidance identifies demand forecasting and inventory analytics as foundational BI applications — helping retailers spot excess stock and supply gaps before they affect margins.

Internal Business Functions

These are the easiest entry points for businesses new to BI:

  • Sales: pipeline tracking, conversion rate analysis, rep performance
  • Marketing: campaign ROI measurement, channel attribution
  • HR: retention trend analysis, recruitment funnel efficiency
  • IT: system performance monitoring, incident pattern detection

Most businesses already generate the data for these use cases. The gap is usually in connecting it and making it visible.


How to Build a BI Strategy for Your Business

The most common mistake in BI adoption is starting with technology. The right starting point is the questions your business needs answered.

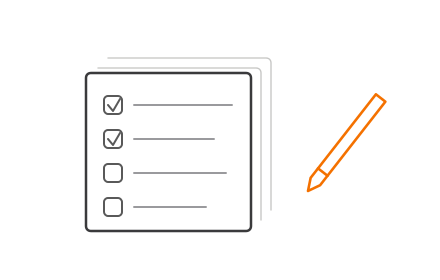
Step 1 — Define your business objectives What decisions are currently slow, inaccurate, or based on incomplete information? Start there. BI strategy follows business strategy, not the other way around.

Step 2 — Map questions to data sources Identify which business questions require which data. Where does that data currently live — CRM, ERP, spreadsheets, marketing platforms? Knowing your sources shapes your architecture decisions.

Step 3 — Make infrastructure decisions

  • Choose a data warehouse for structured data and regular reporting, or a data lake for large volumes of varied, unstructured data
  • Match your BI platform to your team's technical maturity — not every team needs enterprise-grade complexity
  • Build data governance in from the start: Gartner found that 80% of data and analytics governance initiatives will fail by 2027 due to missing governance frameworks — trusted data requires governed data

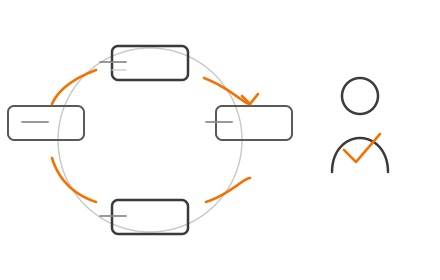
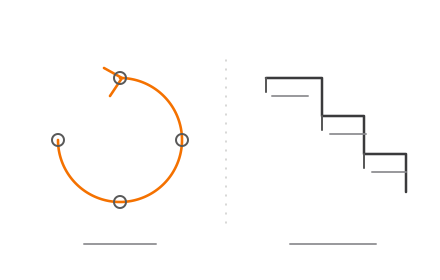
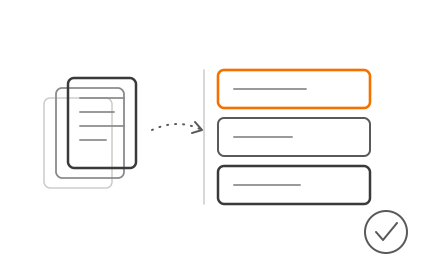
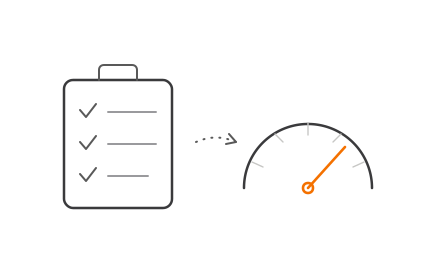
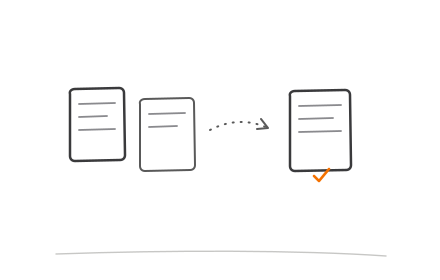
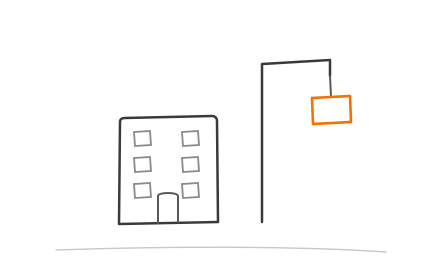
4-step business intelligence strategy building framework from objectives to resourcing

Step 4 — Consider your resourcing model Building BI infrastructure in-house carries real overhead: hiring data engineers, maintaining pipelines, managing platform licences. For organisations without a dedicated data team, partnering with a provider that covers end-to-end data engineering and analytics — like Codiot — can reduce time-to-insight without the fixed cost of building internal infrastructure from scratch.


Frequently Asked Questions

What is business intelligence?

Business intelligence is a set of technologies, processes, and practices that transform raw organisational data into actionable insights. It combines data collection, storage, analysis, and visualisation to help leaders make faster, more informed decisions.

What are the 5 stages of business intelligence?

The five stages are: Data Sourcing, Data Collection & Preparation, Analysis, Visualisation, and Action & Iteration. The process is cyclical. Each round of decisions generates new questions and data, which feeds directly into the next cycle.

What are the 4 types of data analysis in business intelligence?

The four types in order: Descriptive (what happened), Diagnostic (why it happened), Predictive (what will happen), and Prescriptive (what should be done). Most organisations start with descriptive reporting and build toward prescriptive analysis as their data capabilities grow.

What is the difference between business intelligence and business analytics?

BI focuses on descriptive reporting and monitoring of current and historical data. Business analytics extends into predictive and prescriptive methods — forecasting outcomes and recommending actions. In practice, the two are complementary: strong BI infrastructure makes analytics more accurate and faster to act on.

What are the key components of a business intelligence system?

Core components include: data sources, a data warehouse or data lake, ETL pipelines, an analytics and reporting layer, and visualisation tools such as interactive dashboards. Data governance frameworks sit across all of these.

Is business intelligence only for large enterprises?

No. Modern self-service BI platforms are scalable and accessible for startups and SMEs. Smaller businesses can gain meaningful competitive insight without large IT teams, especially by partnering with data engineering providers rather than building infrastructure internally.