Understanding Data Warehousing & Business Intelligence

Introduction

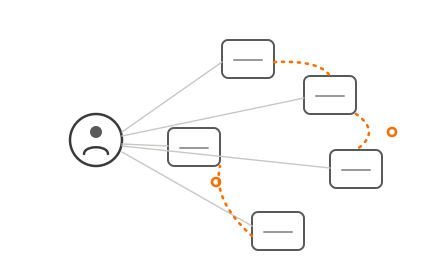
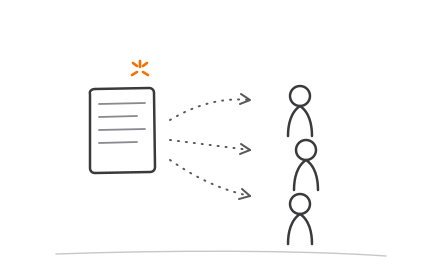
Picture this: three department heads walk into a Monday strategy meeting, each holding a printout showing last quarter's revenue. All three pulled from "the same data." All three have different numbers.

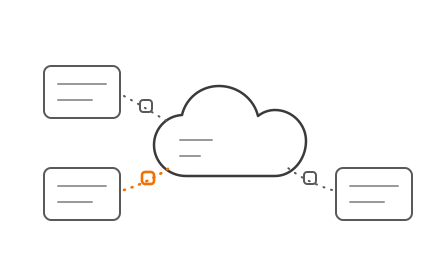
The real problem is infrastructure — and it's more common than most businesses want to admit. A McKinsey survey of over 80 large global organisations found that 80% reported some divisions operating in data silos, each with separate source systems and consumption behaviours.

The downstream effect is significant. Gartner reports that 59% of organisations don't even measure data quality, meaning most businesses are flying blind on the reliability of their own numbers.

Data warehousing and Business Intelligence (BI) are the two-part solution. One stores and organises data reliably. The other turns it into decisions.

This article covers definitions of both, how they work together as a system, and what it takes to build a data foundation that actually supports confident decision-making.


TLDR

  • A data warehouse is a centralised repository that stores integrated, historical data from multiple sources — built for analysis, not day-to-day transactions
  • Business Intelligence (BI) sits on top of that warehouse, transforming stored data into dashboards, reports, and actionable insights
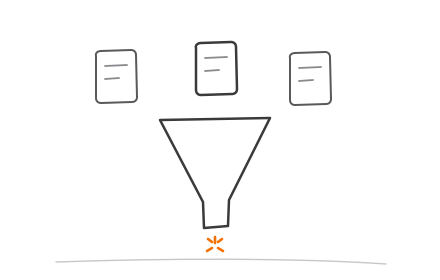
  • The ETL process (Extract, Transform, Load) pulls raw data from source systems, cleans it, and loads it into the warehouse
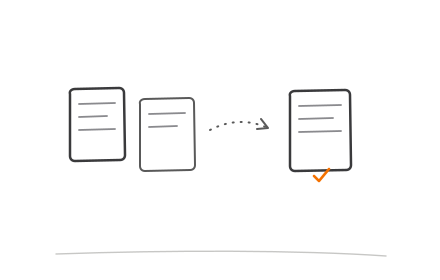
  • Together, DW and BI eliminate data silos and create a single source of truth across every department
  • Cloud-based warehousing (Snowflake, BigQuery, Redshift) has made this infrastructure accessible and affordable for startups, SMEs, and enterprises alike

What Is a Data Warehouse?

A data warehouse is a centralised, purpose-built system designed to store large volumes of integrated, historical, and structured data from multiple sources — optimised not for daily operations, but for complex analysis and reporting.

The foundational definition comes from W. H. Inmon, widely considered the father of data warehousing. He defined it as subject-oriented, integrated, nonvolatile, and time-variant data in support of management decisions:

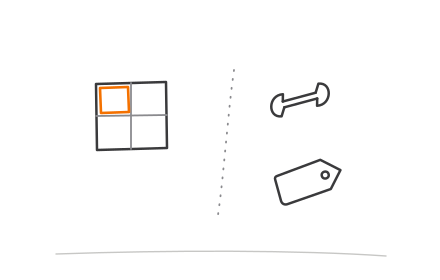
  • Subject-oriented — organised around business topics like sales, customers, or finance
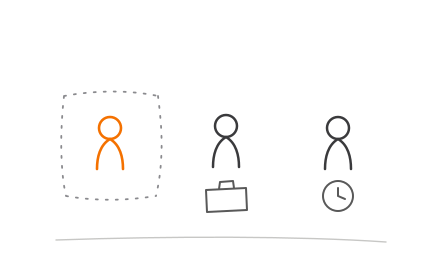
  • Integrated — data from CRM, ERP, and marketing systems is combined and standardised
  • Nonvolatile — once loaded, data doesn't change, providing stable historical records
  • Time-variant — data is stored across time periods, enabling trend analysis over months or years

Types of Data Warehouses

Businesses typically encounter four core warehouse types:

Type Purpose
Enterprise Data Warehouse (EDW) Company-wide; provides a unified view of all data across departments
Operational Data Store (ODS) Designed for real-time, day-to-day operational data
Data Mart A department-specific subset (e.g., sales or marketing) drawn from the broader warehouse
Cloud Data Warehouse A managed, cloud-hosted warehouse (Snowflake, BigQuery, Redshift) with on-demand scaling

Beyond warehouse type, deployment model also matters. Businesses choose between on-premise (company-owned servers), cloud-based (pay-as-you-go platforms), or hybrid. According to BARC's 2024 Data Management Survey covering 909 participants across 45 countries, only 26% of companies remained exclusively on-premises, with 33% using SaaS and 20% using public cloud. Cloud is now the default choice for most organisations.

How a Data Warehouse Stores and Serves Data

Four core components make a warehouse function:

  1. Load Manager — extracts raw data from source systems and loads it into the warehouse
  2. Warehouse Manager — maintains data consistency, creates indexes and aggregations
  3. Query Manager — handles and routes user queries efficiently
  4. End-User Access Tools — reporting, querying, OLAP cubes, and data visualisation interfaces

4-component data warehouse architecture diagram showing load query and access layers

The querying method that makes warehouses effective for BI is OLAP (Online Analytical Processing). Unlike standard databases, OLAP supports multi-dimensional analysis — allowing users to slice data across multiple variables simultaneously, such as revenue by region by product line by quarter, without any performance drag on live systems.


What Is Business Intelligence?

Business Intelligence (BI) is the overarching set of technologies, processes, and practices used to collect, integrate, analyse, and present business data — with the goal of enabling faster, evidence-based decisions at every level of an organisation.

A common misconception: BI is not just dashboards. It spans:

  • Data mining — discovering hidden patterns in large datasets
  • Performance tracking — monitoring KPIs against targets in real time
  • Statistical analysis — identifying correlations and causality in business data
  • Data visualisation — turning complex datasets into charts, graphs, and maps
  • Data storytelling — translating numbers into narratives that drive action (and get acted on)

How BI Drives Decision-Making

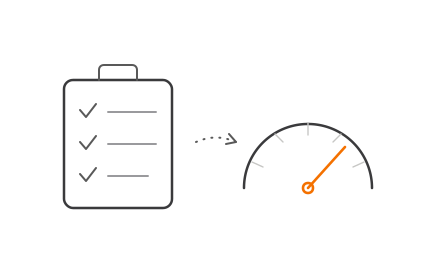
BI's primary job is converting raw data into decision fuel — giving executives, managers, and frontline teams a clear, evidence-based picture of what's happening in the business.

The ROI is measurable. A Forrester Total Economic Impact study commissioned by Microsoft found Power BI users reported a 366% three-year ROI, 125 hours saved per BI user per year through self-service analytics, and 22.6% faster solutions quoting. These are vendor-commissioned figures, but they reflect a consistent pattern: reducing the gap between a business question and its answer has direct commercial value.

Modern BI platforms have also moved well beyond static reports. AI-powered features now include:

  • Natural language querying — ask Power BI questions in plain English, get visualisations in return
  • Automated anomaly detection — Power BI automatically identifies and explains unusual data patterns
  • Tableau Pulse delivers automated, personalised updates on whichever metrics each user tracks — no analyst required

Non-technical users can now extract meaningful insights without writing a single line of SQL. For startups and SMEs that don't have dedicated data teams, that removes a significant barrier to actually using the data they already have.


How Data Warehousing and BI Work Together

The data warehouse and BI layer solve adjacent problems. The warehouse handles storage, consistency, and data modelling. The BI layer handles querying, interpretation, and presentation. They must be designed as a system — not treated as interchangeable tools.

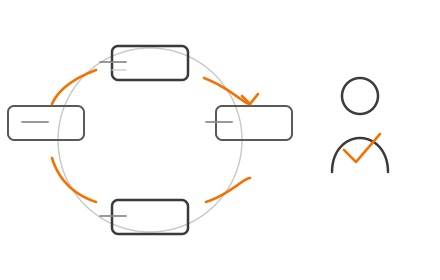
The pipeline connecting raw data to actionable decisions follows four steps:

  1. Collect — gather data from source systems: CRM, ERP, marketing platforms, finance tools
  2. Store — load data into a centralised warehouse
  3. Transform/Model — clean and structure data through ETL pipelines
  4. Analyse — apply BI tools to query, visualise, and interpret that data

The ETL Process: The Bridge Between Data Sources and the Warehouse

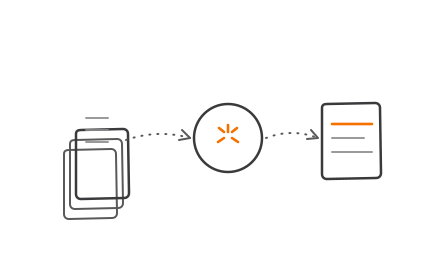
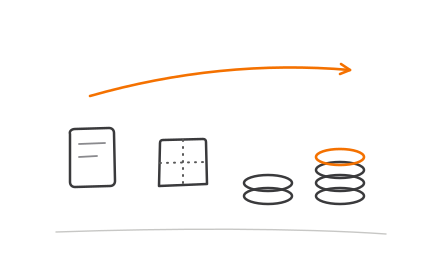
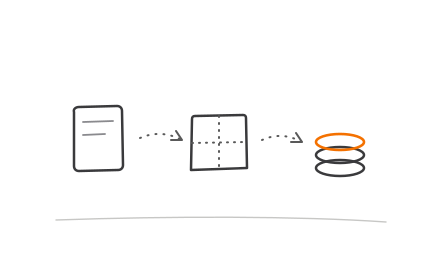
ETL stands for Extract, Transform, Load — and it's what ensures data quality across the organisation:

  • Extract — pull raw data from multiple source systems (CRM records, transaction logs, web analytics)
  • Transform — clean, standardise, deduplicate, and restructure data to fit the organisation's data model
  • Load — place the prepared data into the warehouse, ready for querying

ETL process flow infographic extract transform load data pipeline steps

This process is what prevents the "three departments, three revenue numbers" problem. When data passes through a consistent transformation layer before entering the warehouse, definitions align and reporting becomes trustworthy.

ELT (Extract, Load, Transform) is a modern alternative that flips the sequence — raw data loads into the warehouse first, then transforms inside it. This matters at scale: the pre-load transformation step in traditional ETL becomes a bottleneck as data volumes grow. For cloud-native environments like BigQuery or Snowflake, ELT is often the more practical fit.

BI Tools That Connect to Data Warehouses

Once data is prepared and loaded, the BI layer takes over. BI platforms sit as the "experience layer" on top of the warehouse, connecting directly to query and visualise data without moving or duplicating it. Major platforms — Power BI, Tableau, Qlik, and Looker — all support native connections to Redshift, BigQuery, and Snowflake through official connectors.

One common mistake: building data models that only answer predefined dashboard questions. When business questions shift — a new product line, a market pivot, a regulatory change — a rigid model requires rebuilding from scratch. Data models designed for reuse and exploration mean analysts can answer new questions without waiting on engineering. That flexibility is often what separates a BI investment that compounds in value from one that stagnates.


Key Benefits of Combining a Data Warehouse with BI

Single Source of Truth

When all departments query from the same warehouse, conflicting reports disappear. "Revenue," "customer count," and "conversion rate" carry the same definition everywhere — because they're all calculated from the same underlying data model. IBM describes a single source of truth as a reliable source of information that unites business data across the organisation. That shared foundation means strategy meetings move faster — teams spend time acting on data rather than debating which number is right.

Faster, More Accurate Decisions

Consolidating historical data into one accessible system dramatically shortens the gap between question and answer. A Forrester TEI study for Google BigQuery and BigLake found survey respondents reported a 35% productivity improvement for data analysts, driven by faster access to and analysis of data. Self-service BI multiplies this effect — when business users can answer their own questions without waiting for a data team, decision cycles shrink from days to hours.

Deeper Analysis at Scale

A well-structured warehouse makes it possible to:

  • Run complex, multi-year trend analyses that fragmented source systems simply can't support
  • Identify customer behaviour patterns across channels and time periods
  • Execute ad-hoc queries without touching production systems or disrupting daily operations

For startups and enterprises alike, that analytical depth translates directly into sharper forecasting, better resource allocation, and faster market response.


Data Warehouse vs. Traditional Databases

The core distinction comes down to purpose:

Transactional Database (OLTP) Data Warehouse (OLAP)
Optimised for Speed in daily transactions Complex analysis across large datasets
Operations Insert, update, delete individual records Read and aggregate historical data
Query type Simple, high-frequency Complex, multi-dimensional
Example use Processing an order, updating a customer record Analysing three years of sales trends by region

OLTP transactional database versus OLAP data warehouse side-by-side comparison infographic

Most businesses need both. OLTP databases handle live operations. The data warehouse handles analysis, doing so without putting any load on the production systems keeping the business running. Data flows from operational databases into the warehouse via ETL pipelines, keeping the two environments separated.

The Future of Data Warehousing and BI

Cloud-Native Warehousing Is Now the Default

The largest barrier to data warehousing used to be cost — building an on-premise infrastructure required significant upfront capital. Cloud-native platforms have changed that equation. Amazon Redshift, Google BigQuery, and Snowflake all operate on consumption-based or on-demand pricing models, meaning businesses pay for what they actually use. No server procurement, no expensive capacity planning upfront.

This accessibility matters especially for startups and SMEs, who can now build enterprise-grade analytics infrastructure incrementally rather than all at once.

AI Is Reshaping What BI Can Do

The augmented analytics market — which covers AI-powered BI capabilities like natural language queries, automated insights, and predictive analytics — was valued at USD 16.60 billion in 2023 and is projected to reach USD 97.87 billion by 2030 at a 28.0% CAGR, according to Grand View Research.

The practical implications are significant. Non-technical users can query complex datasets in plain language. Anomalies surface automatically rather than being discovered weeks later in a board report. Predictive models flag problems before they appear in the numbers.

Getting Started With the Right Partner

Building and optimising a data warehousing and BI infrastructure requires cross-functional expertise across several disciplines:

  • Data engineering and ETL pipeline design
  • Cloud architecture and platform selection
  • AI integration for predictive and augmented analytics

Building and optimising a data warehousing and BI infrastructure requires cross-functional expertise across several disciplines:

  • Data engineering and ETL pipeline design
  • Cloud architecture and platform selection
  • AI integration for predictive and augmented analytics

Codiot's data engineering and Business Intelligence services cover this full spectrum — from pipeline architecture to AI-driven analytics — helping startups, SMEs, and enterprises move from fragmented data to a governed, insight-ready infrastructure without building that capability from scratch internally.


Frequently Asked Questions

What are the 4 types of data warehouses?

The four primary types are: Enterprise Data Warehouse (EDW) for organisation-wide unified data; Operational Data Store (ODS) for real-time operational data; Data Mart for department-specific subsets like sales or marketing; and Cloud Data Warehouse (Snowflake, BigQuery, Redshift) for managed, scalable cloud-hosted analytics.

What are the 5 steps of ETL?

A typical ETL process covers: (1) identify source systems, (2) extract raw data, (3) validate and clean data, (4) transform data into the target schema, and (5) load it into the warehouse. The exact steps vary by implementation, and modern cloud environments often use ELT — where loading precedes transformation.

What is the difference between a data warehouse and a database?

Traditional databases (OLTP) handle real-time transactional operations — inserts, updates, and single-record retrieval. Data warehouses (OLAP) are optimised for historical analysis and complex multi-dimensional queries. Most organisations run both, with data flowing from operational databases into the warehouse via ETL.

Can small businesses benefit from data warehousing and BI?

Yes. Cloud platforms like Snowflake, BigQuery, and Redshift use consumption-based pricing, removing large upfront costs and making DW and BI accessible to SMEs and startups. Businesses can start with a single data mart and scale as analytical needs grow.

What BI tools work best with a data warehouse?

Power BI, Tableau, Qlik, and Looker all offer native connectors to major cloud warehouses including Redshift, BigQuery, and Snowflake. The best choice depends on your organisation's existing tech stack, the technical proficiency of your end users, and the cloud platform hosting your warehouse.

Is cloud data warehousing better than on-premise?

For most modern businesses, yes — cloud warehousing offers greater scalability, lower upfront cost, and far less maintenance overhead. On-premise solutions remain relevant in heavily regulated industries with strict data residency requirements, but account for a shrinking share of new deployments.